


Dr. Hugh Cutcher
February 11, 2026
Share this post
A relatively mild start to 2026 across much of North America gave way to a dramatic end to January, as severe winter storms swept across the continent following a disruption of the polar vortex, according to analysis using the Solcast API. Late January also saw a significant solar storm, as detected by NOAA, though this is not likely to have any impacts on PV power generation.
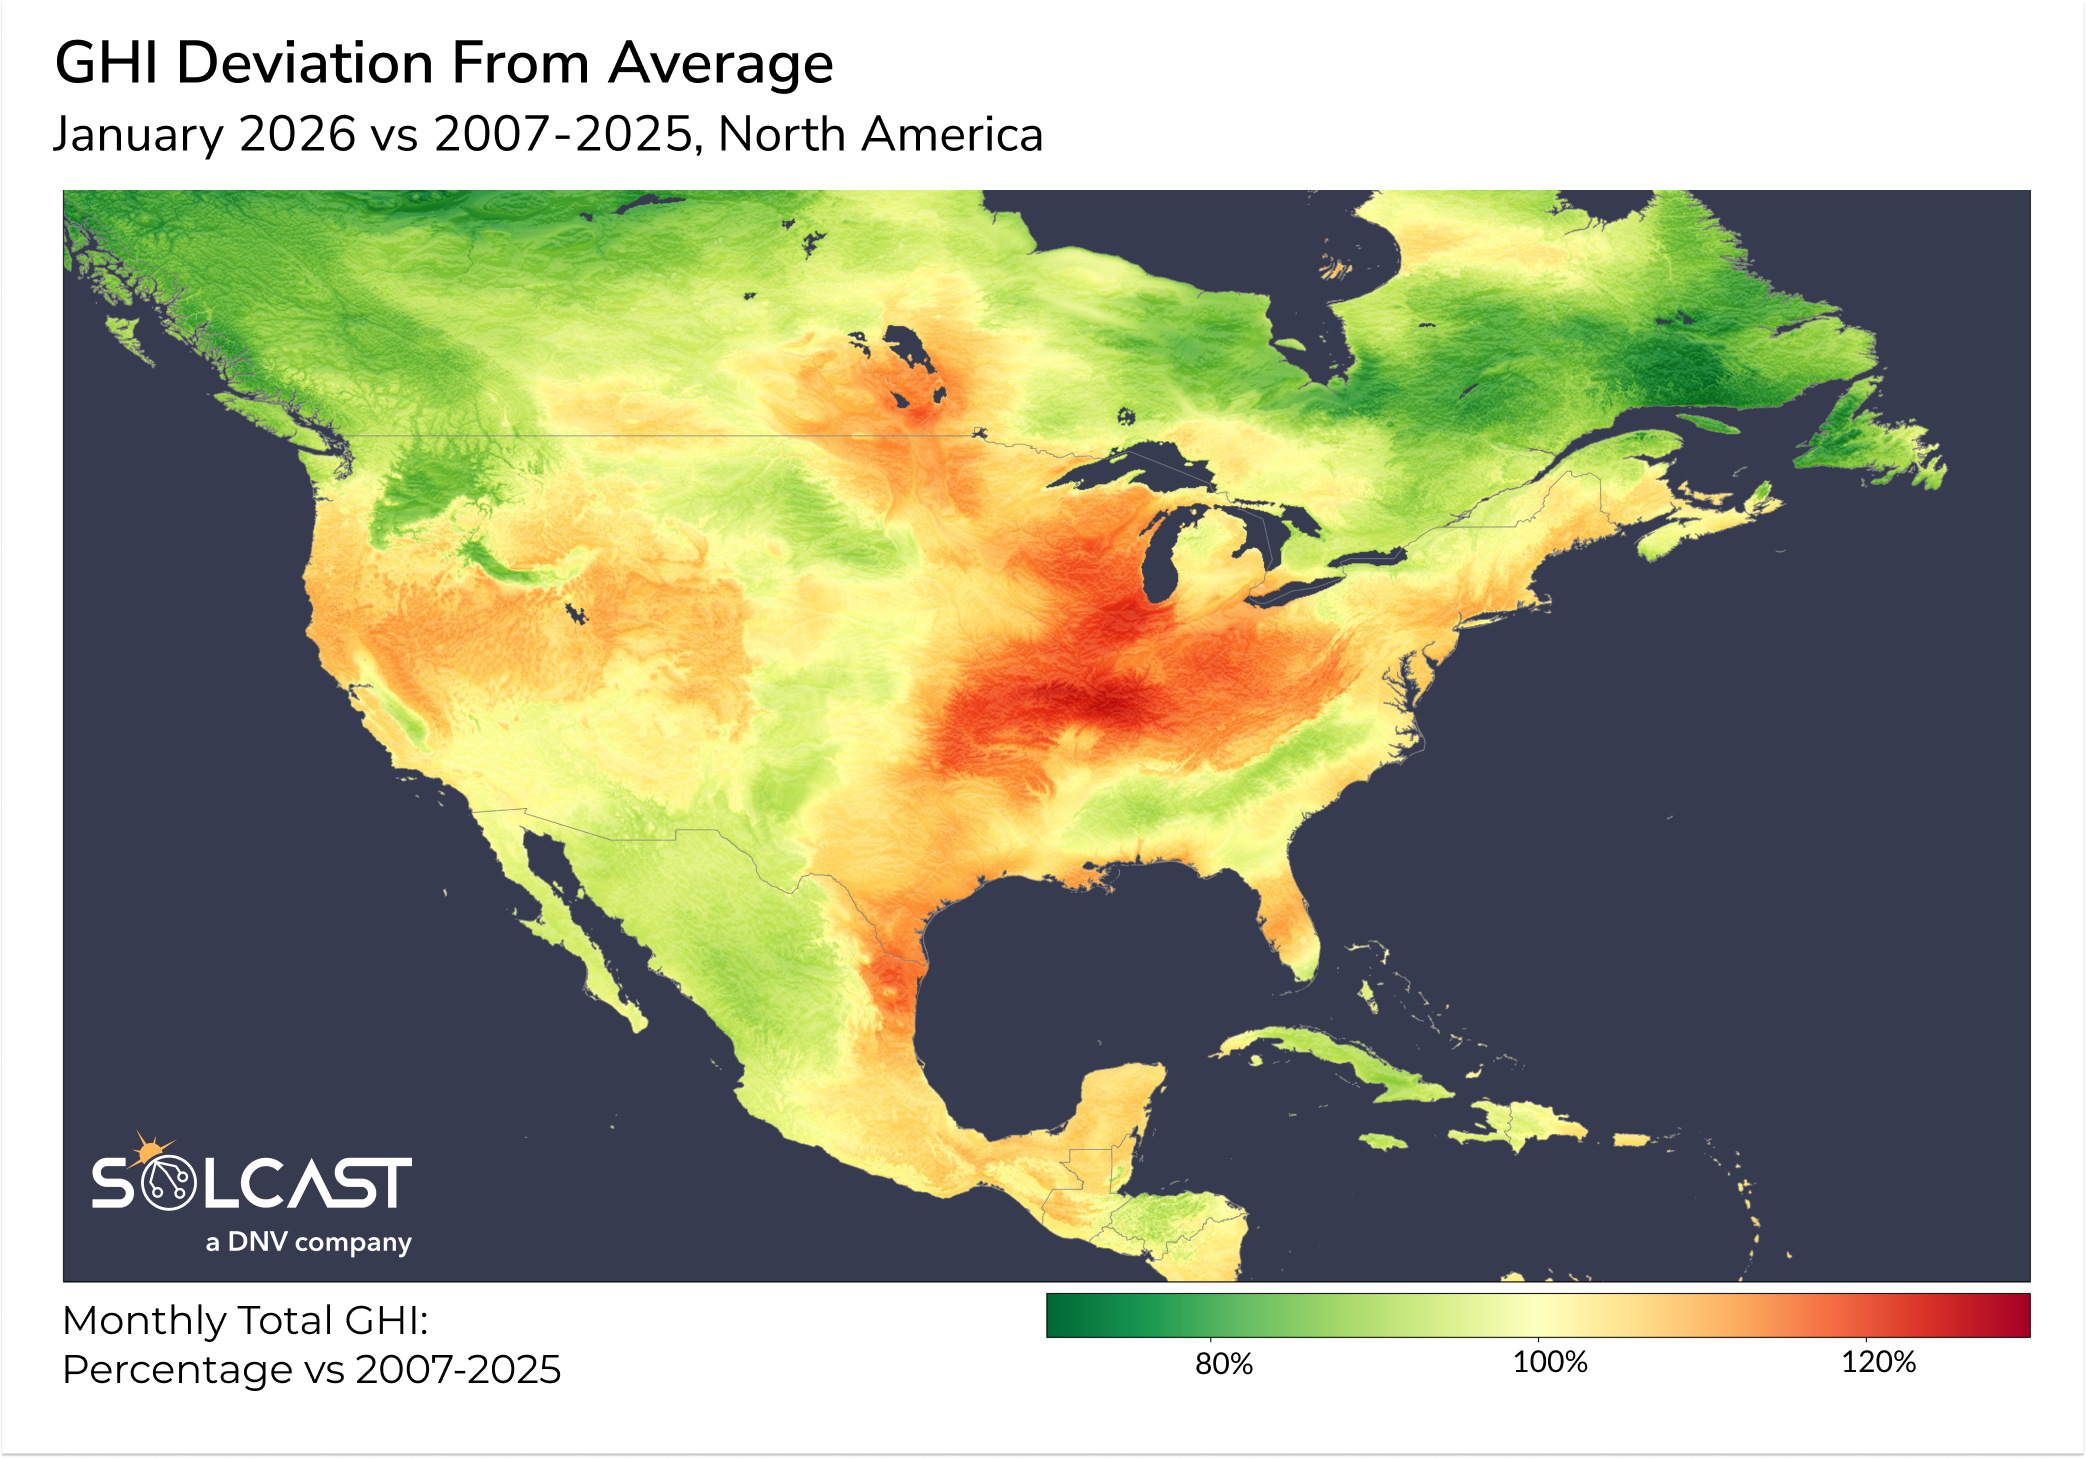
The eastern half of the United States generally fared better than average, with Illinois and Kansas regions seeing 15-20% more irradiance than the long term January average. Early in the month, a relatively stable polar vortex confined the coldest air to the north, allowing much of the continental United States to experience milder conditions than typical for mid-winter. This also limited the extent and persistence of cloud systems across the eastern states, supporting more favorable solar conditions from the Great Lakes to Texas. North of the border, however, Canada remained under more persistent cloudy conditions. Further south, a series of low-pressure systems off the California and Mexican Pacific coasts drew moist maritime air inland. This increased cloud cover across western Mexico, suppressing solar radiation compared with seasonal norms.
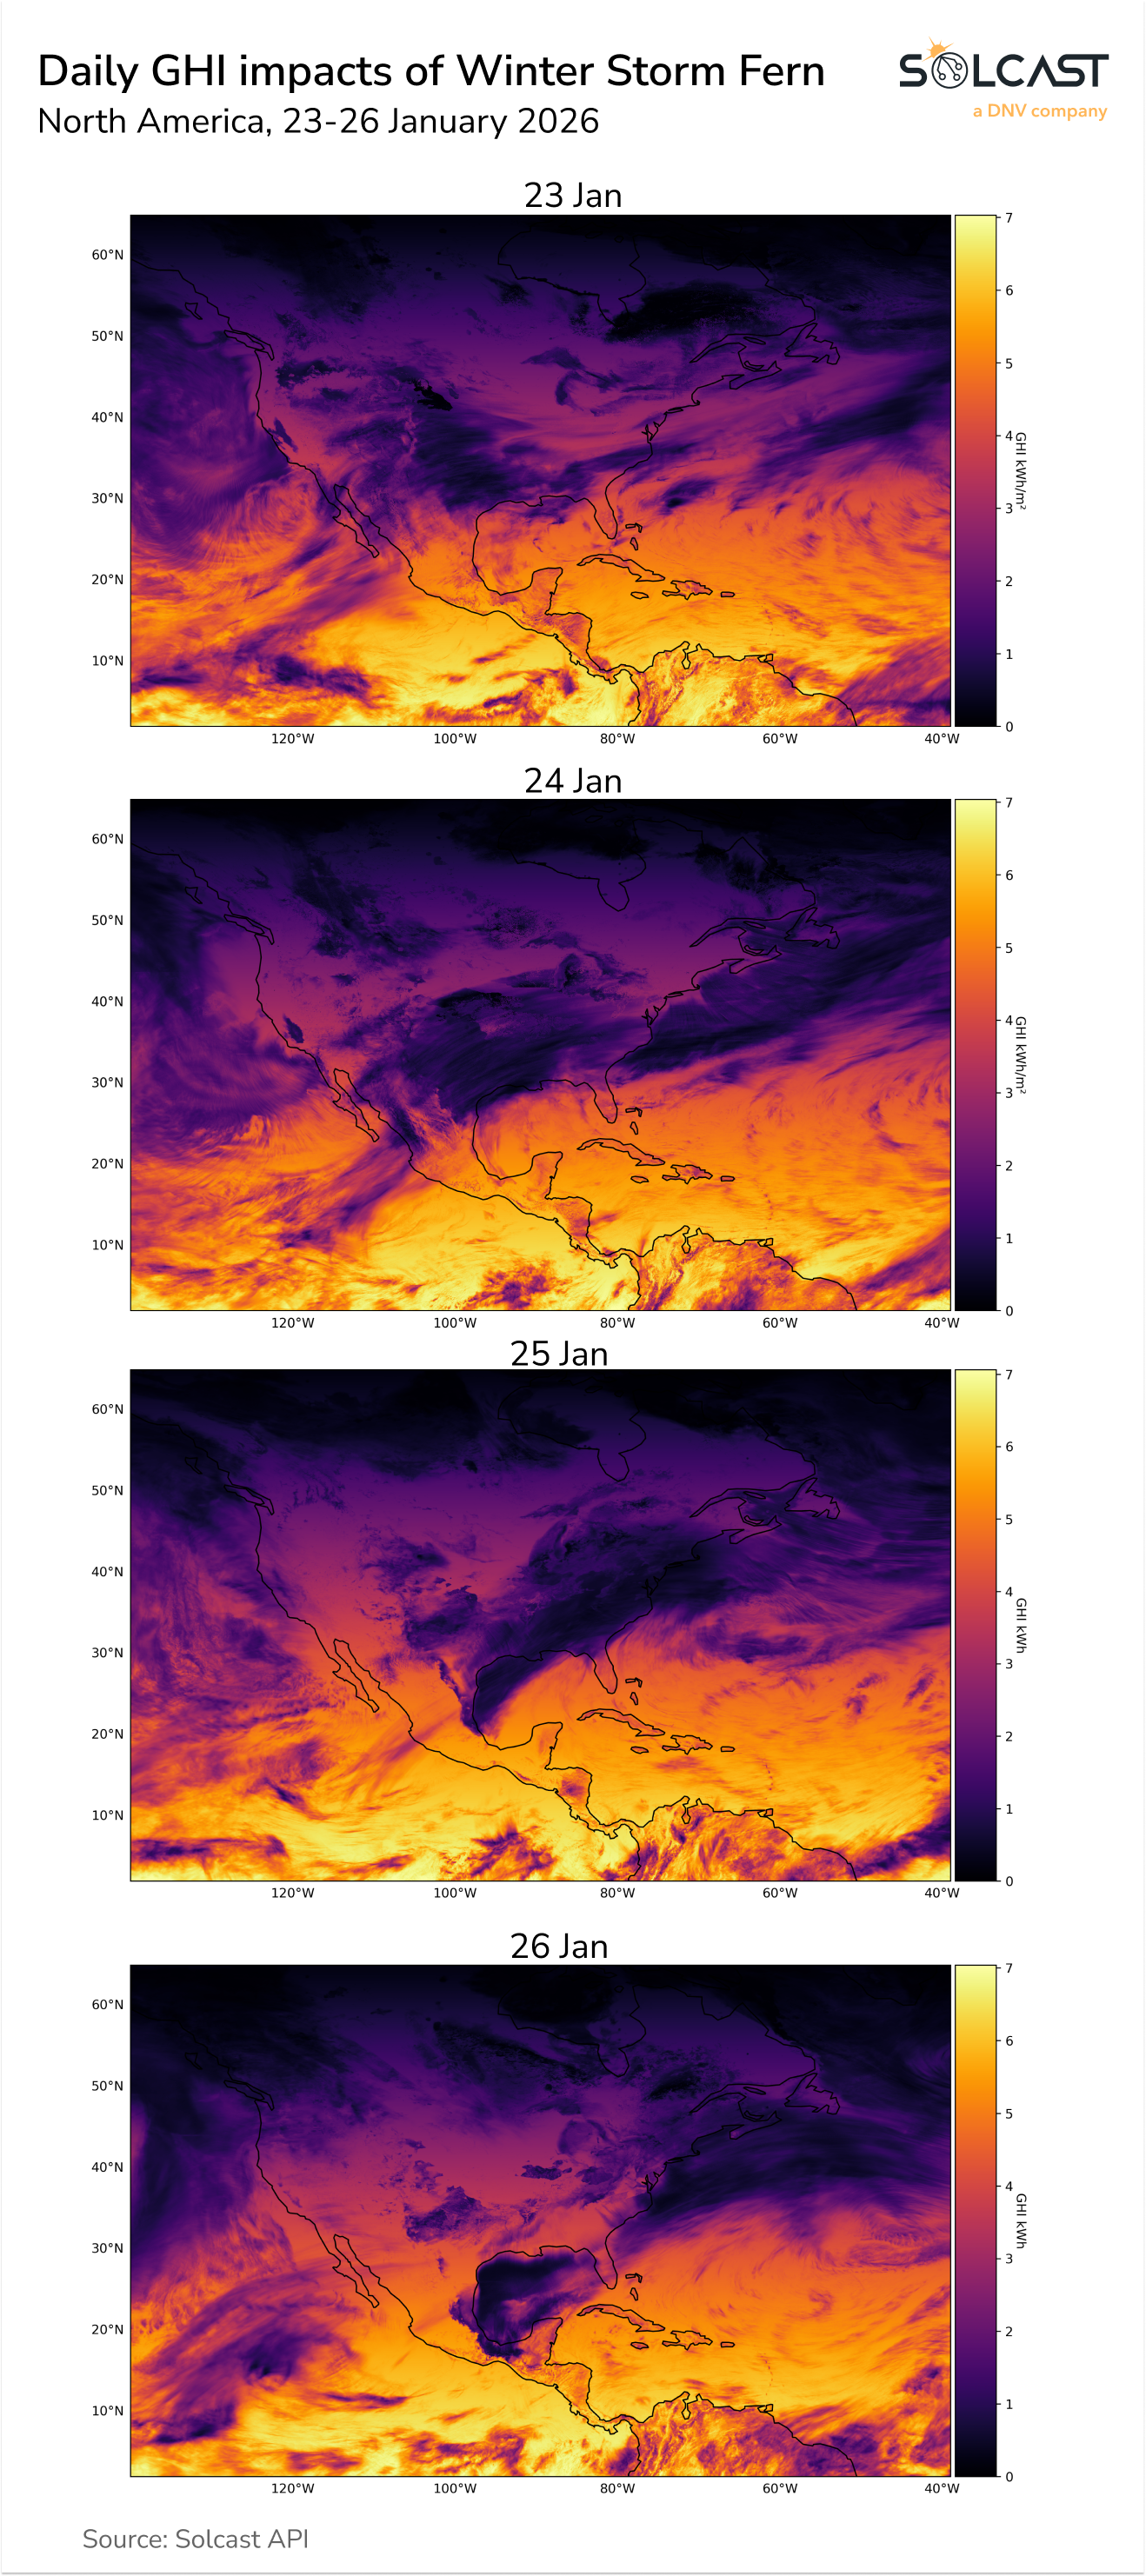
The defining feature of January, however, arrived late in the month with Winter Storm Fern. This system brought widespread freezing temperatures, snow, ice, and dense cloud cover across large portions of the United States. The storm was triggered by a disruption of the polar vortex following stratospheric warming, a process that weakened the usual containment of cold Arctic air. This disruption was further amplified by a low-pressure system in the Pacific, which helped deepen and steer the cold outbreak southward.
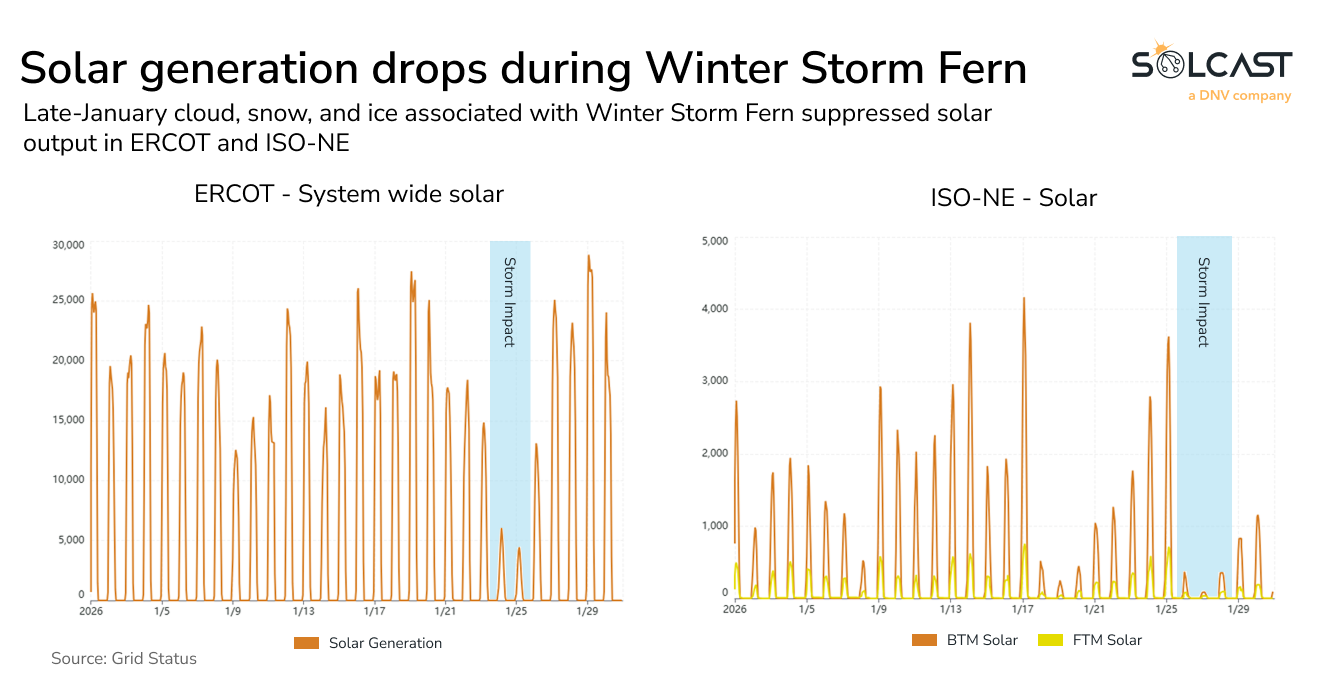
As the storm’s thick cloud shield moved across the continent, available solar irradiance dropped to only a small fraction of normal winter levels in affected regions. This is evident in grid data from Electric Reliability Council of Texas (ERCOT) and ISO New England (ISO-NE), where solar generation dropped sharply as clouds from the storm passed. At the same time, sharply colder temperatures increased heating demand, shifting the broader generation mix toward non-solar sources during the peak of the event.
.png)
Adding a separate but notable dimension to the month, NOAA reported a severe solar radiation storm on January 19, classified at S4 intensity. Events of this magnitude have not been observed since 2003. While such storms are unrelated to the surface irradiance that drives photovoltaic performance, and therefore don’t directly impact PV power generation, they can interfere with satellites. This includes the satellites used both by NOAA to assess solar radiation storms and by Solcast to monitor clouds and aerosols. In this case, however, no measurable impact on Solcast data quality was observed.
Track weather conditions, cloud movements, and irradiance-influencing factors that might impact your solar generation. Access bankable actuals and accurate forecasts when you sign up for a Solcast API toolkit. You can reach out to our team for an extended trial.