








Dr. Hugh Cutcher
July 8, 2026
Share this post
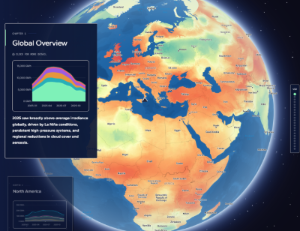
Global solar resource was redistributed through the first half of 2026 as early-year blocking patterns and polar vortex disruption in the Northern Hemisphere gave way to developing El Niño conditions from April, according to analysis using the Solcast API. Much of Europe, the United States, Southeast Asia, South America and Central Africa saw irradiance 5–10% above the long-term average, while most of Canada, Mexico, South Africa, Northern Africa, parts of Western Russia and Central Asia were 5–10% below average.
The first-half map shows how this redistribution played out spatially, with clear contrasts between above- and below-average irradiance across major solar markets.
.png)
Most of Europe saw significantly more solar than normal across the first half of 2026. The pattern began in winter, when cold, dry air reduced cloud cover across parts of eastern and northern Europe, lifting irradiance even as storm systems reduced solar resource farther west. Spring reinforced the surplus.
This above-average pattern is visible across much of Europe, where clearer conditions extended across western, central and some northern regions.

In April, persistent high pressure over the North Sea kept skies clearer across western and northern Europe, with France 13% above the 2007–2025 baseline, Germany 11% above average, and Finland 16% above normal.
May continued the pattern as clearer skies extended from Spain to Ukraine, with the strongest anomalies centred around Austria, where irradiance reached as much as 25% above normal.
For solar production, the practical impact was extended periods of stronger irradiance across several major European markets, despite local reductions around the edges of the weather systems.
This sustained uplift is reflected in cumulative irradiance, where gains built steadily through the first half.
Saharan dust is a recurring feature of Europe’s solar resource, with multiple events each year reducing irradiance and increasing soiling across impacted regions.
One such event is shown below, where a March dust transport reduced solar resource across southern Europe.
.png)
Solar resource in North America was more varied. The United States saw repeated periods of above-average irradiance through winter and early spring, after late-January storm disruption gave way to clearer conditions across large parts of the central, eastern, southern and western U.S. The pattern changed in the second quarter. Western and interior markets remained near or above average, while Texas and the Gulf Coast moved negative as moisture, cloud and rainfall reduced irradiance.
The cumulative trend shows how early gains were reduced as cloud and rainfall increased through spring.
California’s Central Valley also recorded below-average irradiance, where persistent tule fog suppressed solar resource during extended periods as can be seen in the maps below. The seasonal shift is clear when comparing the first and second quarters.
.png)
Broader gains across much of the United States in winter and early spring gave way to a more regional pattern from April, with clearer contrasts between inland regions and reduced irradiance across the south, particularly impacting Texas and solar production in ERCOT.
South America illustrates in January how wildfire smoke can reduce solar resource even when broader conditions are otherwise clear.
The broader first-half pattern shows how these regional contrasts accumulated over time.
.png)
January conditions illustrate how cloud and smoke shaped irradiance outcomes across the continent.
Northern regions saw irradiance reductions of up to 15% as rainfall and storm activity increased cloud cover. Farther south, hotter and drier conditions across northern Argentina and central Chile reduced cloud formation and lifted irradiance in some areas, but wildfire smoke reduced available sunlight during otherwise clearer periods.
For solar sites, this meant clear-sky conditions did not always translate into the same gain in surface irradiance.
.png)
Asia’s first-half pattern did not follow a single consistent regional split, instead shifting between northern and southern markets as cloud and rainfall patterns changed. Southern and coastal China started strongly in January and February, as reduced cloud cover and lower aerosol levels lifted irradiance, with Hong Kong more than 25% above average in January and parts of southern China and Taiwan remaining above average in February.
Early gains in southern China are reflected in cumulative irradiance trends.
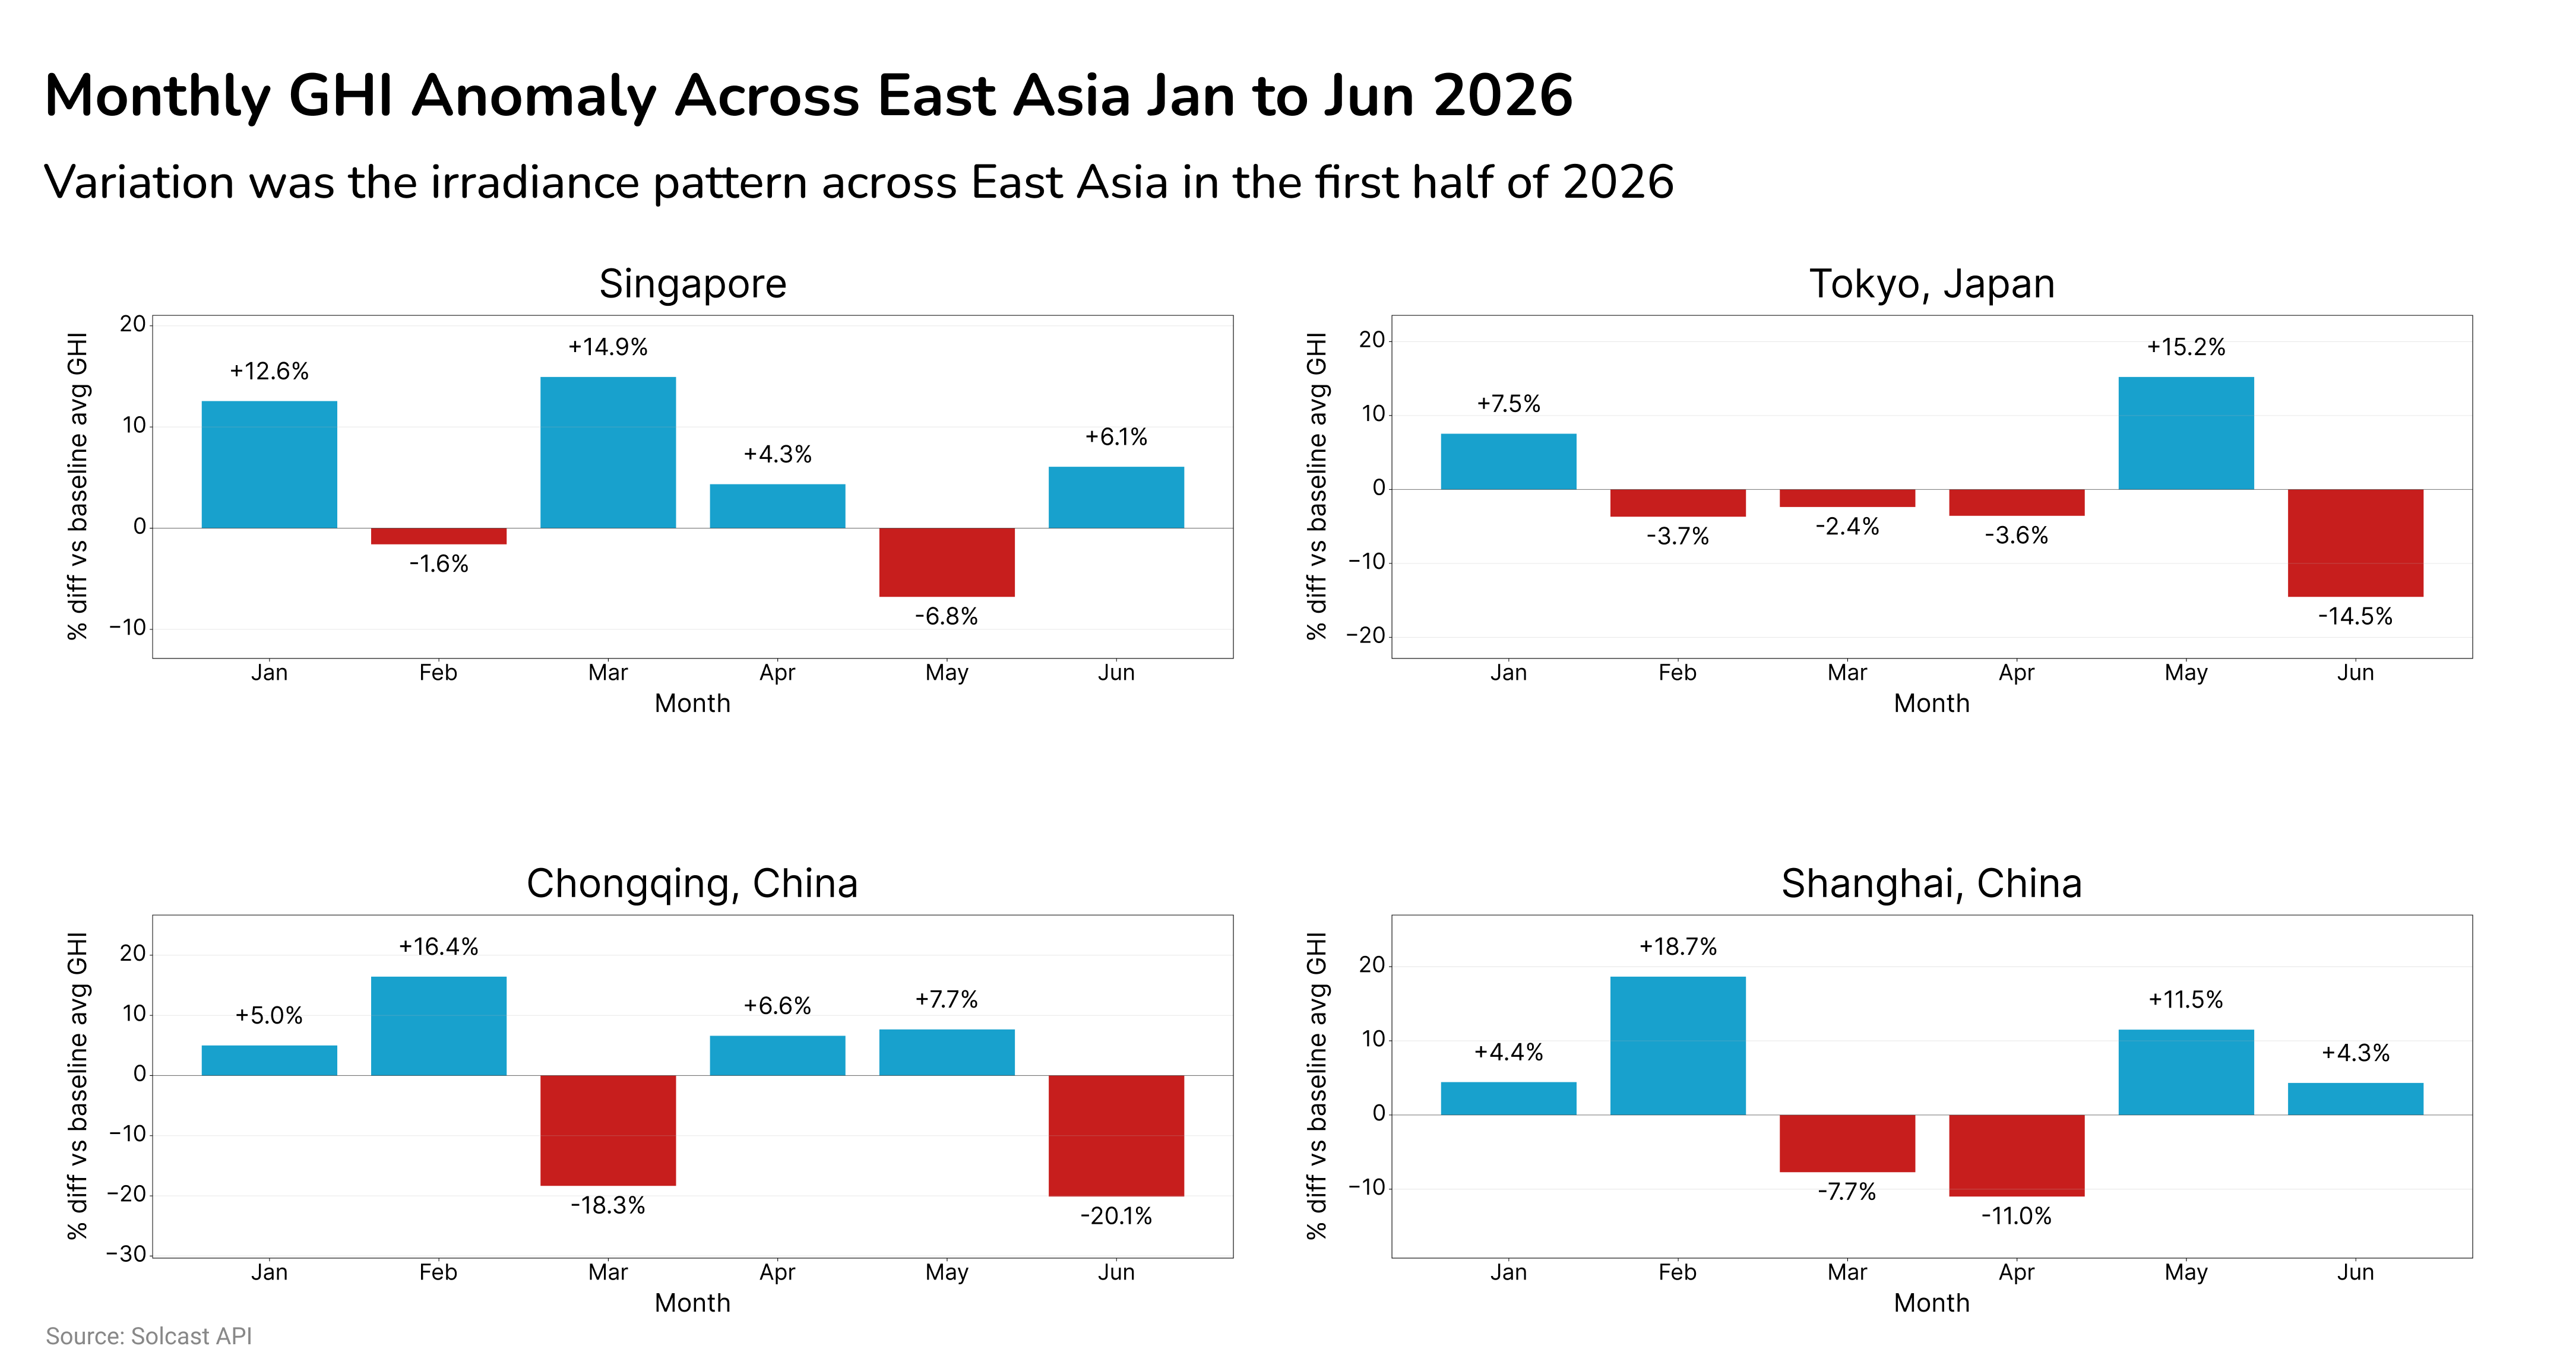
By April, the strongest gains shifted south into mainland Southeast Asia, where clearer, drier conditions lifted irradiance and Bangkok recorded its sunniest April since 2007. At the same time, persistent cloud and rainfall reduced irradiance across eastern China, with the Yangtze Delta around 10% below average.
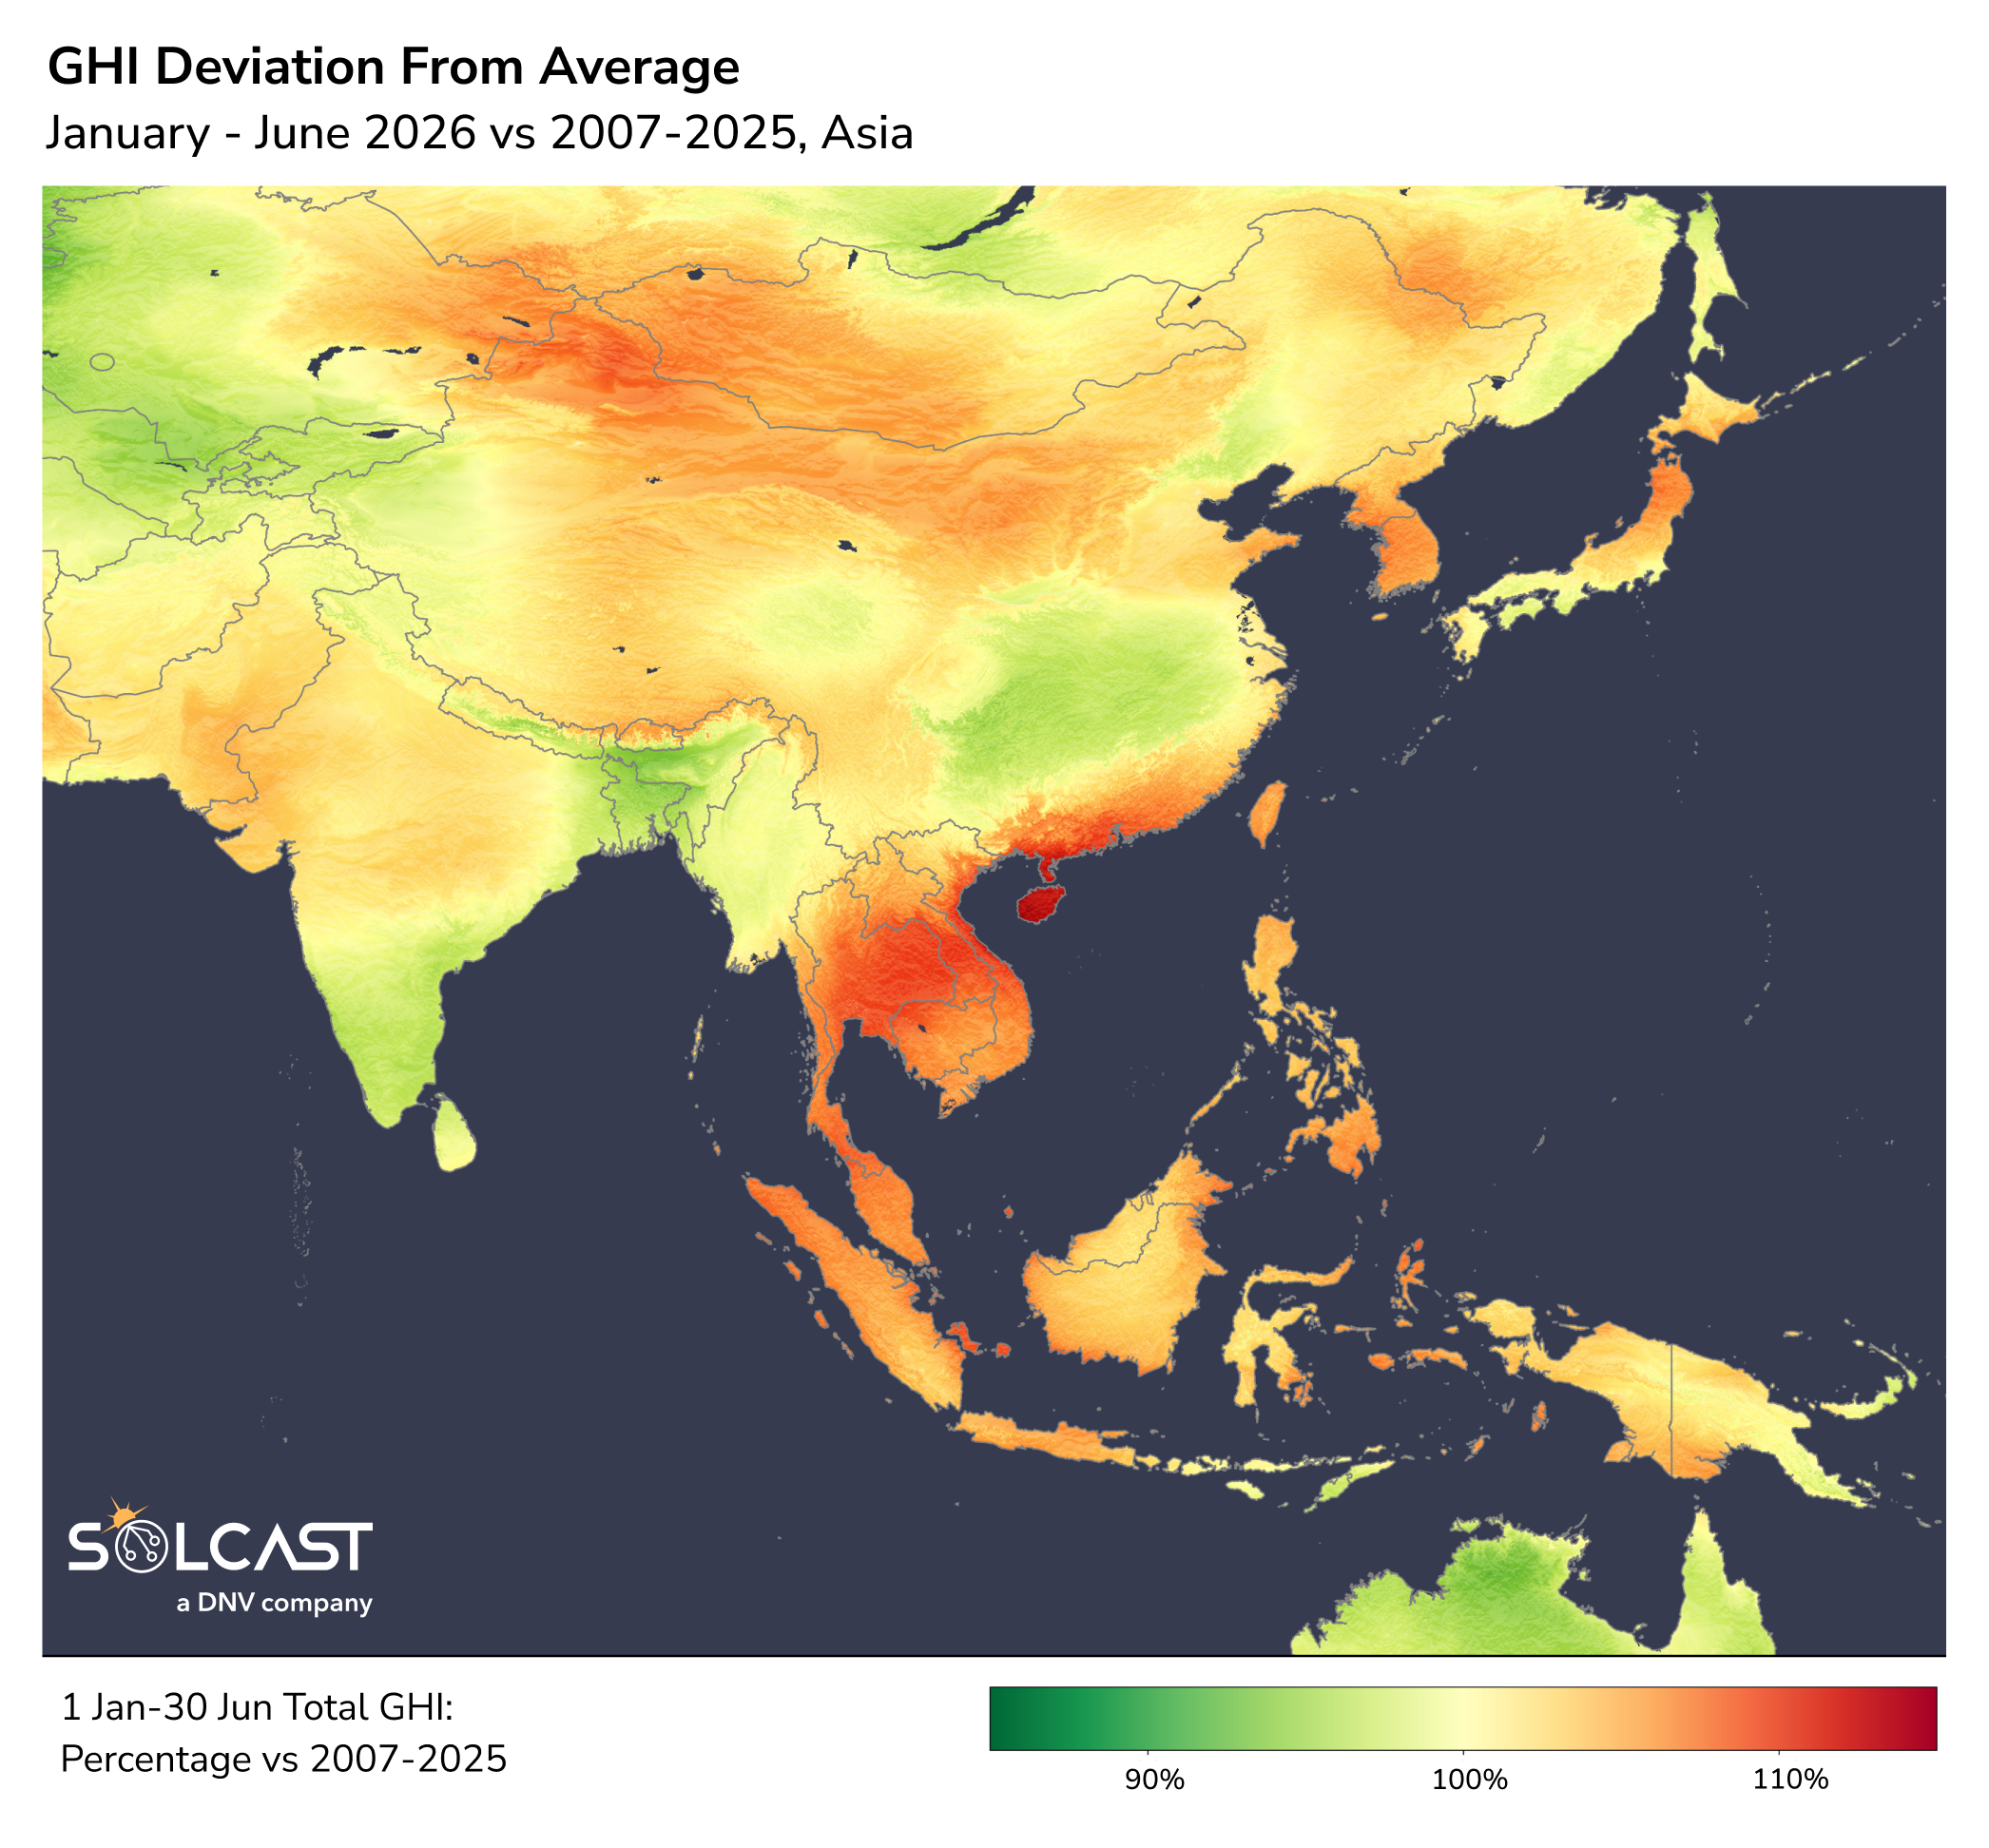
By May, the contrast had shifted again, with stronger irradiance returning to parts of coastal East Asia while cloud and rainfall reduced solar resource elsewhere across the region.
.png)
Neighbouring markets recorded very different irradiance outcomes under these cloud and rainfall patterns across the first half of the year.
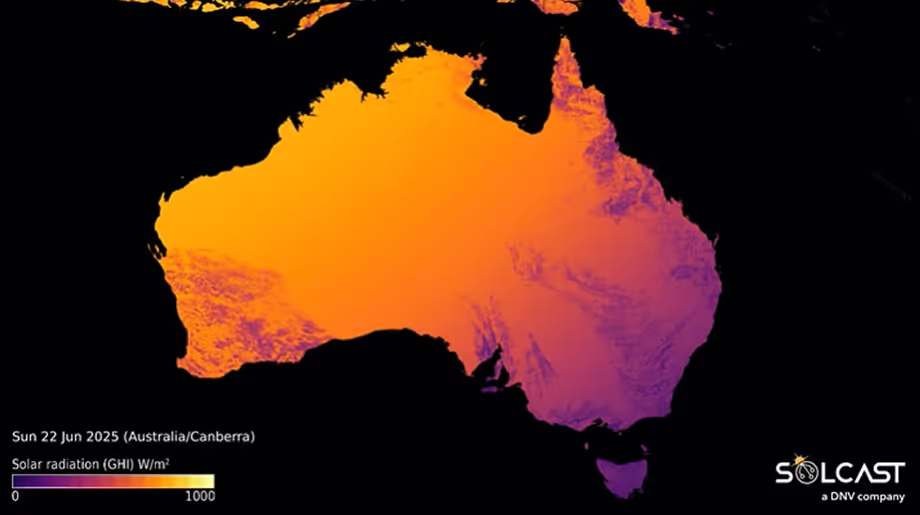
Australia followed a clear central–coastal contrast through the first half, with below-average irradiance across central Australia and stronger solar resource along parts of the east and west coasts.
Repeated cyclone-driven cloud and rainfall suppressed irradiance inland, while coastal regions experienced more frequent clear periods.
January was mostly above average, but monsoonal cloud and Tropical Cyclone Koji reduced irradiance in the tropical north. Cyclone Mitchell contributed to Australia’s wettest February since 2011, driving 15–30% irradiance deficits across central and eastern regions, before Cyclone Narelle brought cloud, rainfall and dust impacts across Queensland, the Northern Territory and Western Australia in March. Cyclone Malia later limited April irradiance gains in Far North Queensland and the Northern Territory.
The cumulative impact of these events is visible across northern Australia.
For solar operators in affected inland and northern regions, the pattern meant more variable irradiance, higher soiling risk from dust, and more challenging site conditions during periods of heavy rain and cyclone activity, while coastal regions saw stronger solar resource in parts of the east and west.
Across the first half of 2026, Europe saw broad irradiance gains, while the United States remained above average overall despite more localised disruptions across Texas, the Gulf Coast and parts of California. Asia, South America and Australia showed greater regional variability driven by cloud, rainfall, dust, smoke and tropical systems. From April, developing El Niño conditions added another layer by reshaping rainfall and cloud cover across Asia and Australia.
Curious about the solar outlook for H2 2026?
While this analysis looks back at H1, our H2 Solar Outlook explores what may lie ahead for solar conditions across key markets. Read the full H2 2026 blog.